
Africa’s public debt expanded from $510 billion in 2008 to $1.83 trillion in 2024, a 253% increase in 16 years. But the deeper story is not just how much African nations owe. It is who owes it, how debt is structured, and whether the continent can manage repayment without weakening growth.
That is the central question in Section 2 of LEAF Africa’s Debt Story report.
Africa’s debt profile has changed dramatically since the global financial crisis of 2008. Multilateral borrowing supported infrastructure, social investment, emergency spending, and post-pandemic recovery. But it also increased exposure to currency risk, global interest-rate cycles, and refinancing pressure.
For investors, policymakers, entrepreneurs, and analysts, the issue is no longer whether Africa has debt. Every region does. The sharper question is whether Africa’s debt is becoming a platform for development or a constraint on future growth.
Why Africa’s Public Debt Matters Now
Africa’s debt story cannot be separated from the global economy.
Global public debt reached $102 trillion in 2024, while Africa accounted for only about 1.9% of the global total. Africa’s own public debt has grown sharply, unevenly, and with important structural differences across countries.
The continent’s public debt reached $1.83 trillion in 2024, after peaking at $1.92 trillion in 2023. That slight decline matters, but it does not erase the longer trend. Africa’s debt stock is now more than three times its 2008 level.
This matters because public debt shapes:
- Government spending capacity
- Infrastructure investment
- Exchange-rate stability
- Investor confidence
- Private-sector credit access
- Tax pressure
- Country risk perception
Debt is not just a fiscal number. It is a macroeconomic signal.
What Is Happening: Africa’s Debt Has Grown in Phases
Africa’s debt did not rise in a straight line. It moved through economic shocks, commodity cycles, low global interest rates, pandemic pressures, and recent restructuring efforts.
2008 to 2024: A 253% increase
According to LEAF Africa’s report, Africa’s public debt rose from $510 billion in 2008 to $1.83 trillion in 2024, representing a 253% increase over 16 years.
The report breaks this expansion into two important periods.
From 2010 to 2017, Africa’s public debt rose from around $650 billion to $1.19 trillion, with a compound annual growth rate of 7.92%. This phase was mainly driven by infrastructure spending and social investments.
From 2017 to 2024, the pace slowed to a 5.52% CAGR, but the absolute debt stock still rose, reaching $1.92 trillion in 2023 before easing to $1.83 trillion in 2024.
The five debt phases
LEAF report’s phase analysis adds context to the numbers:
- 2010–2013: Debt rose gradually from $0.65 trillion to $0.93 trillion, supported by post-global financial crisis recovery and the commodity super-cycle.
- 2014–2016: Debt rose faster from $1.01 trillion to $1.17 trillion, as the oil price collapse hurt exporters such as Nigeria and Angola.
- 2017–2019: Borrowing increased from $1.19 trillion to $1.41 trillion, helped by Eurobond issuances and low global interest rates.
- 2020–2021: Debt jumped from $1.59 trillion to $1.76 trillion as COVID-19 forced emergency health spending, fiscal stimulus, and IMF support loans.
- 2022–2024: Debt plateaued and slightly declined from $1.88 trillion to $1.83 trillion, reflecting tighter global monetary policy, dollar strength, and restructuring efforts in countries such as Zambia, Ghana, and Ethiopia.
The implication is clear: Africa’s debt build-up was not only the result of fiscal indiscipline. It was also shaped by external shocks, development needs, and global financing conditions.
Who Owes the Most?
Africa’s debt burden is highly concentrated.
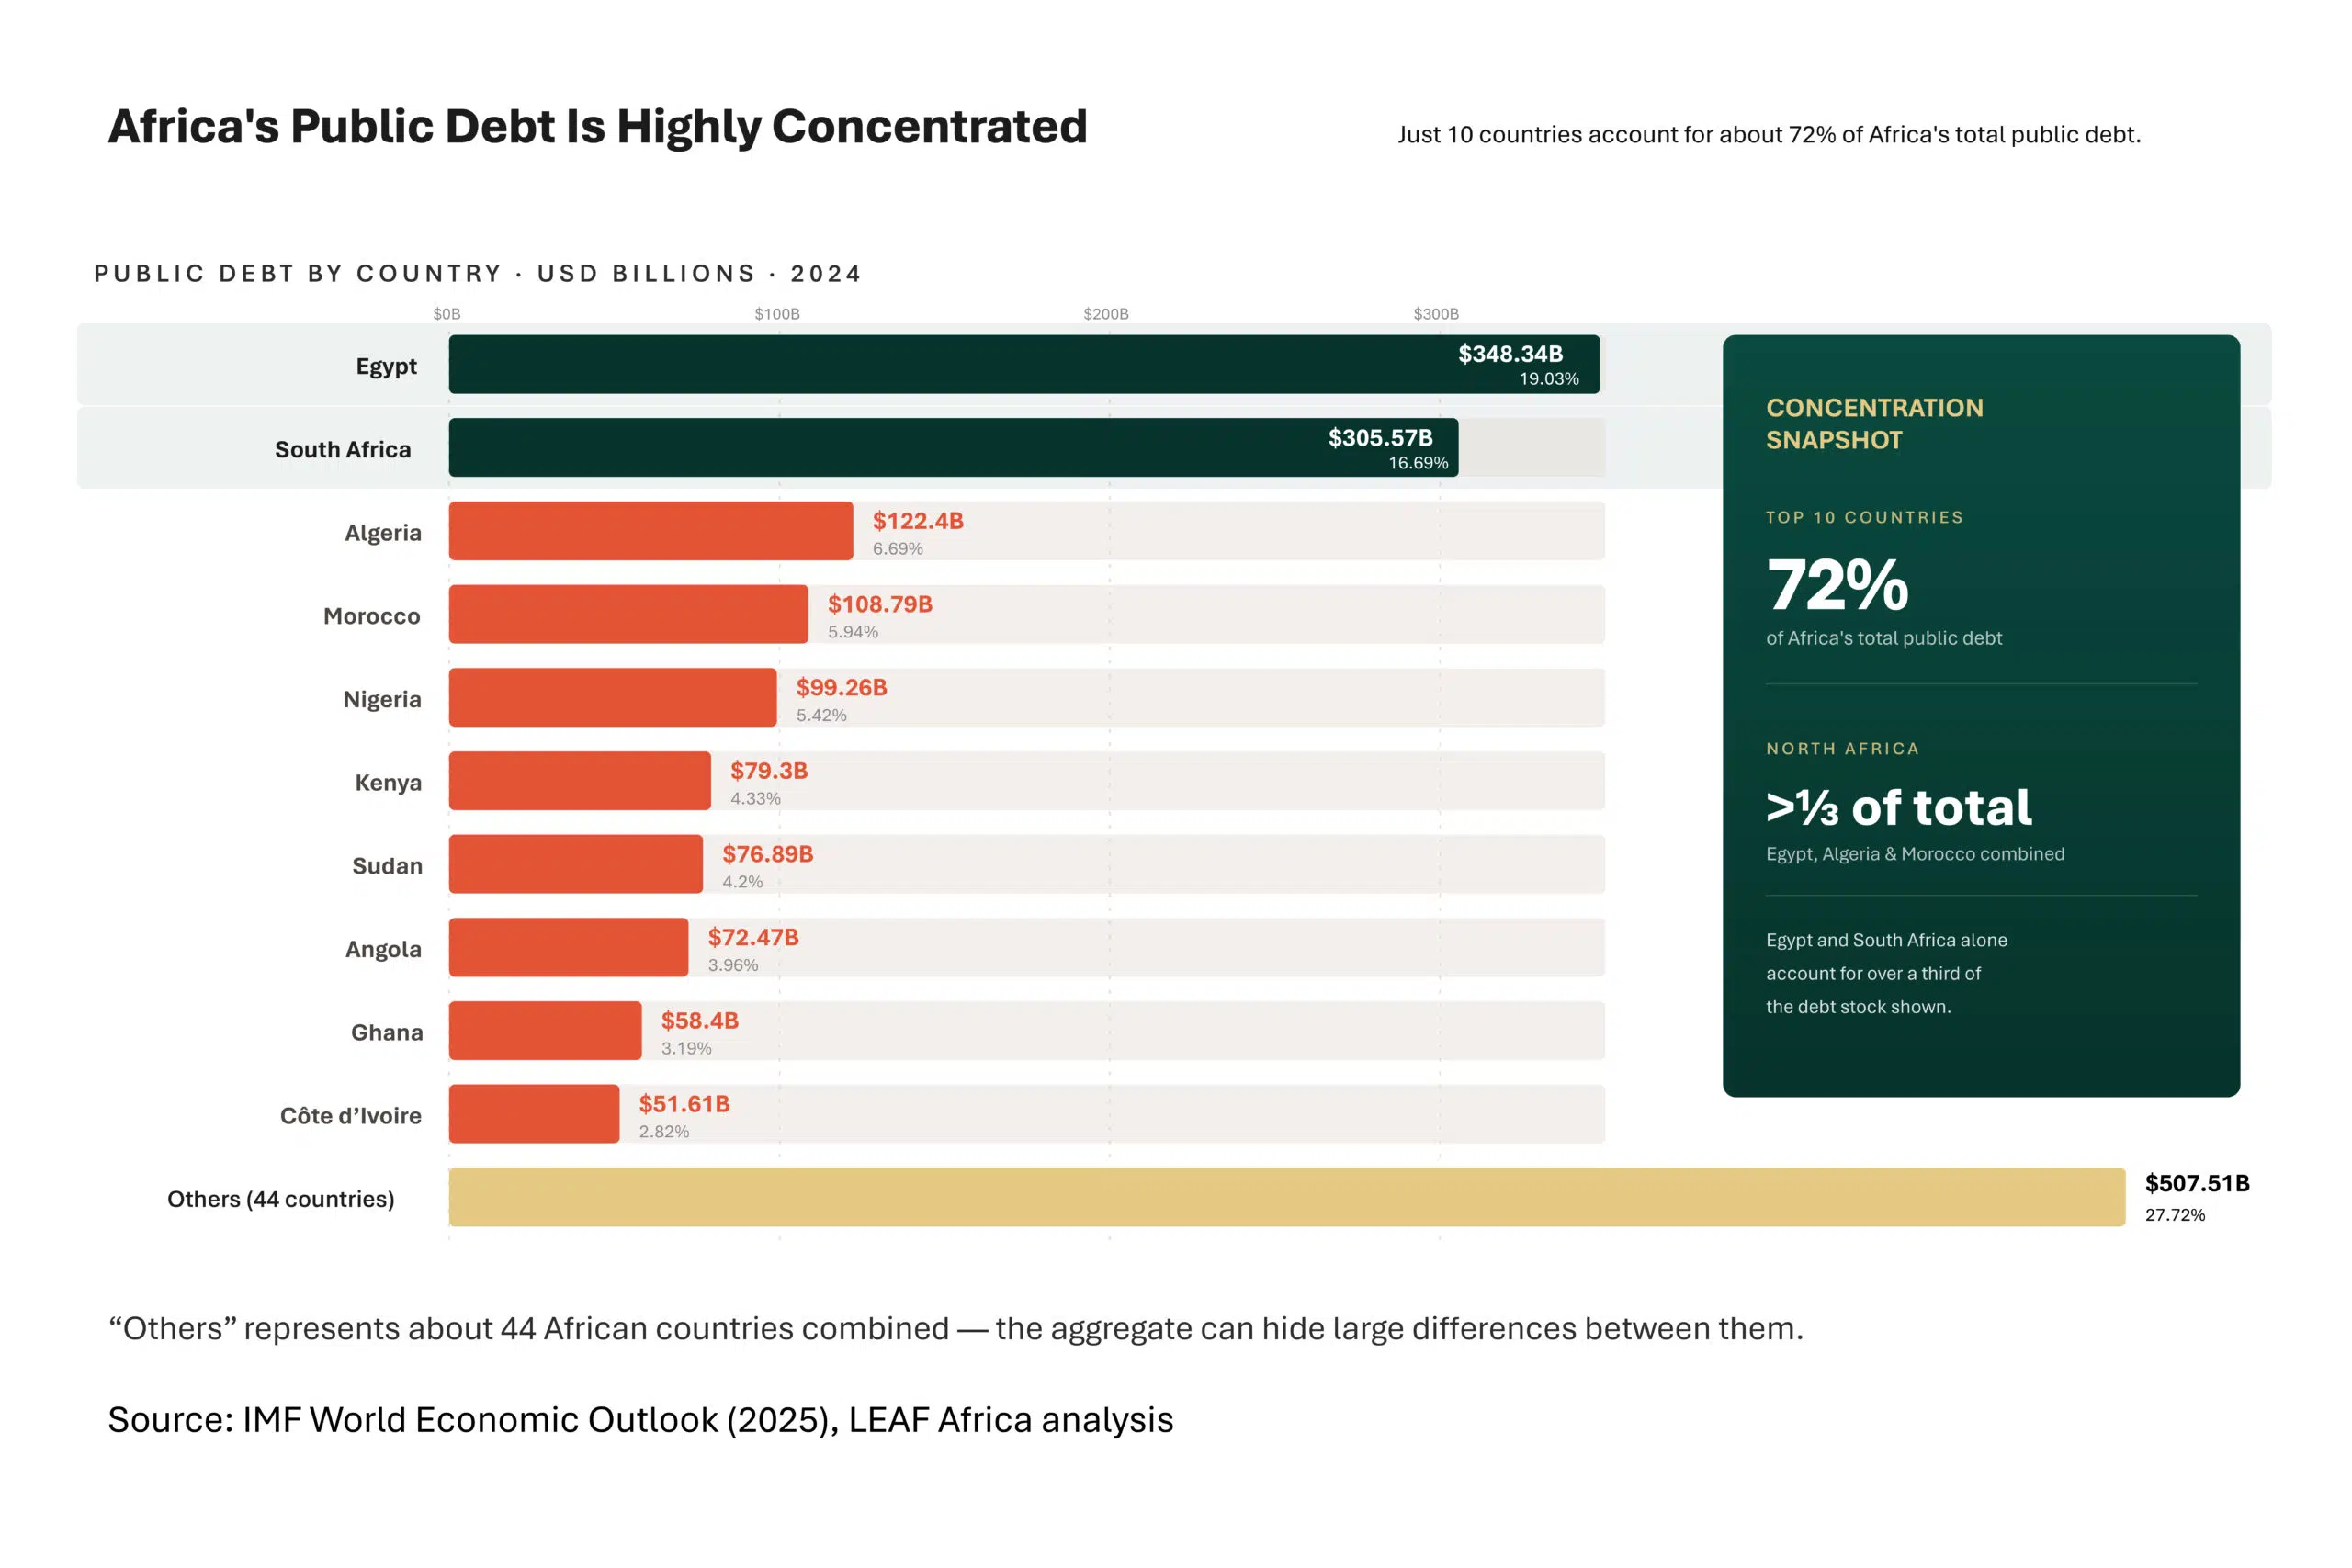
Just 10 countries account for about 72% of Africa’s public debt: Egypt, South Africa, Algeria, Morocco, Nigeria, Kenya, Sudan, Angola, Ghana, and Côte d’Ivoire. North Africa alone holds over one-third of the continent’s total.
Africa’s top public debt holders in 2024
Egypt leads with $348.34 billion, representing 19.03% of Africa’s total public debt. South Africa follows with $305.57 billion, or 16.69%. Algeria holds $122.40 billion, while Morocco holds $108.79 billion and Nigeria holds $99.26 billion.
The report also shows that “Others,” representing about 44 African countries, hold a combined $507.51 billion, averaging about $11.5 billion per country.
What this concentration means
Debt concentration changes how Africa’s debt story should be read.
It means the continent’s aggregate debt number is heavily shaped by a few large economies. Egypt and South Africa alone account for more than one-third of the top debt stock shown in the report. This does not mean smaller economies are safe. Some may have lower absolute debt, but higher debt-to-GDP ratios, weaker export bases, or greater debt-service pressure.
For investors, the lesson is to avoid a blanket “Africa risk” view. Africa’s debt profile is country specific. The risks in Egypt are different from the risks in Kenya, Ghana, Angola, or Côte d’Ivoire.
For policymakers, the lesson is equally direct: debt sustainability must be measured through fiscal capacity, currency exposure, debt structure, and growth prospects, not headline debt stock alone.
External vs Domestic Debt: The Structure Behind the Risk
The most important insight into Section 2 of LEAF Africa's Debt Story Report is not just that Africa owes more. It is that the composition of what Africa owes has changed.
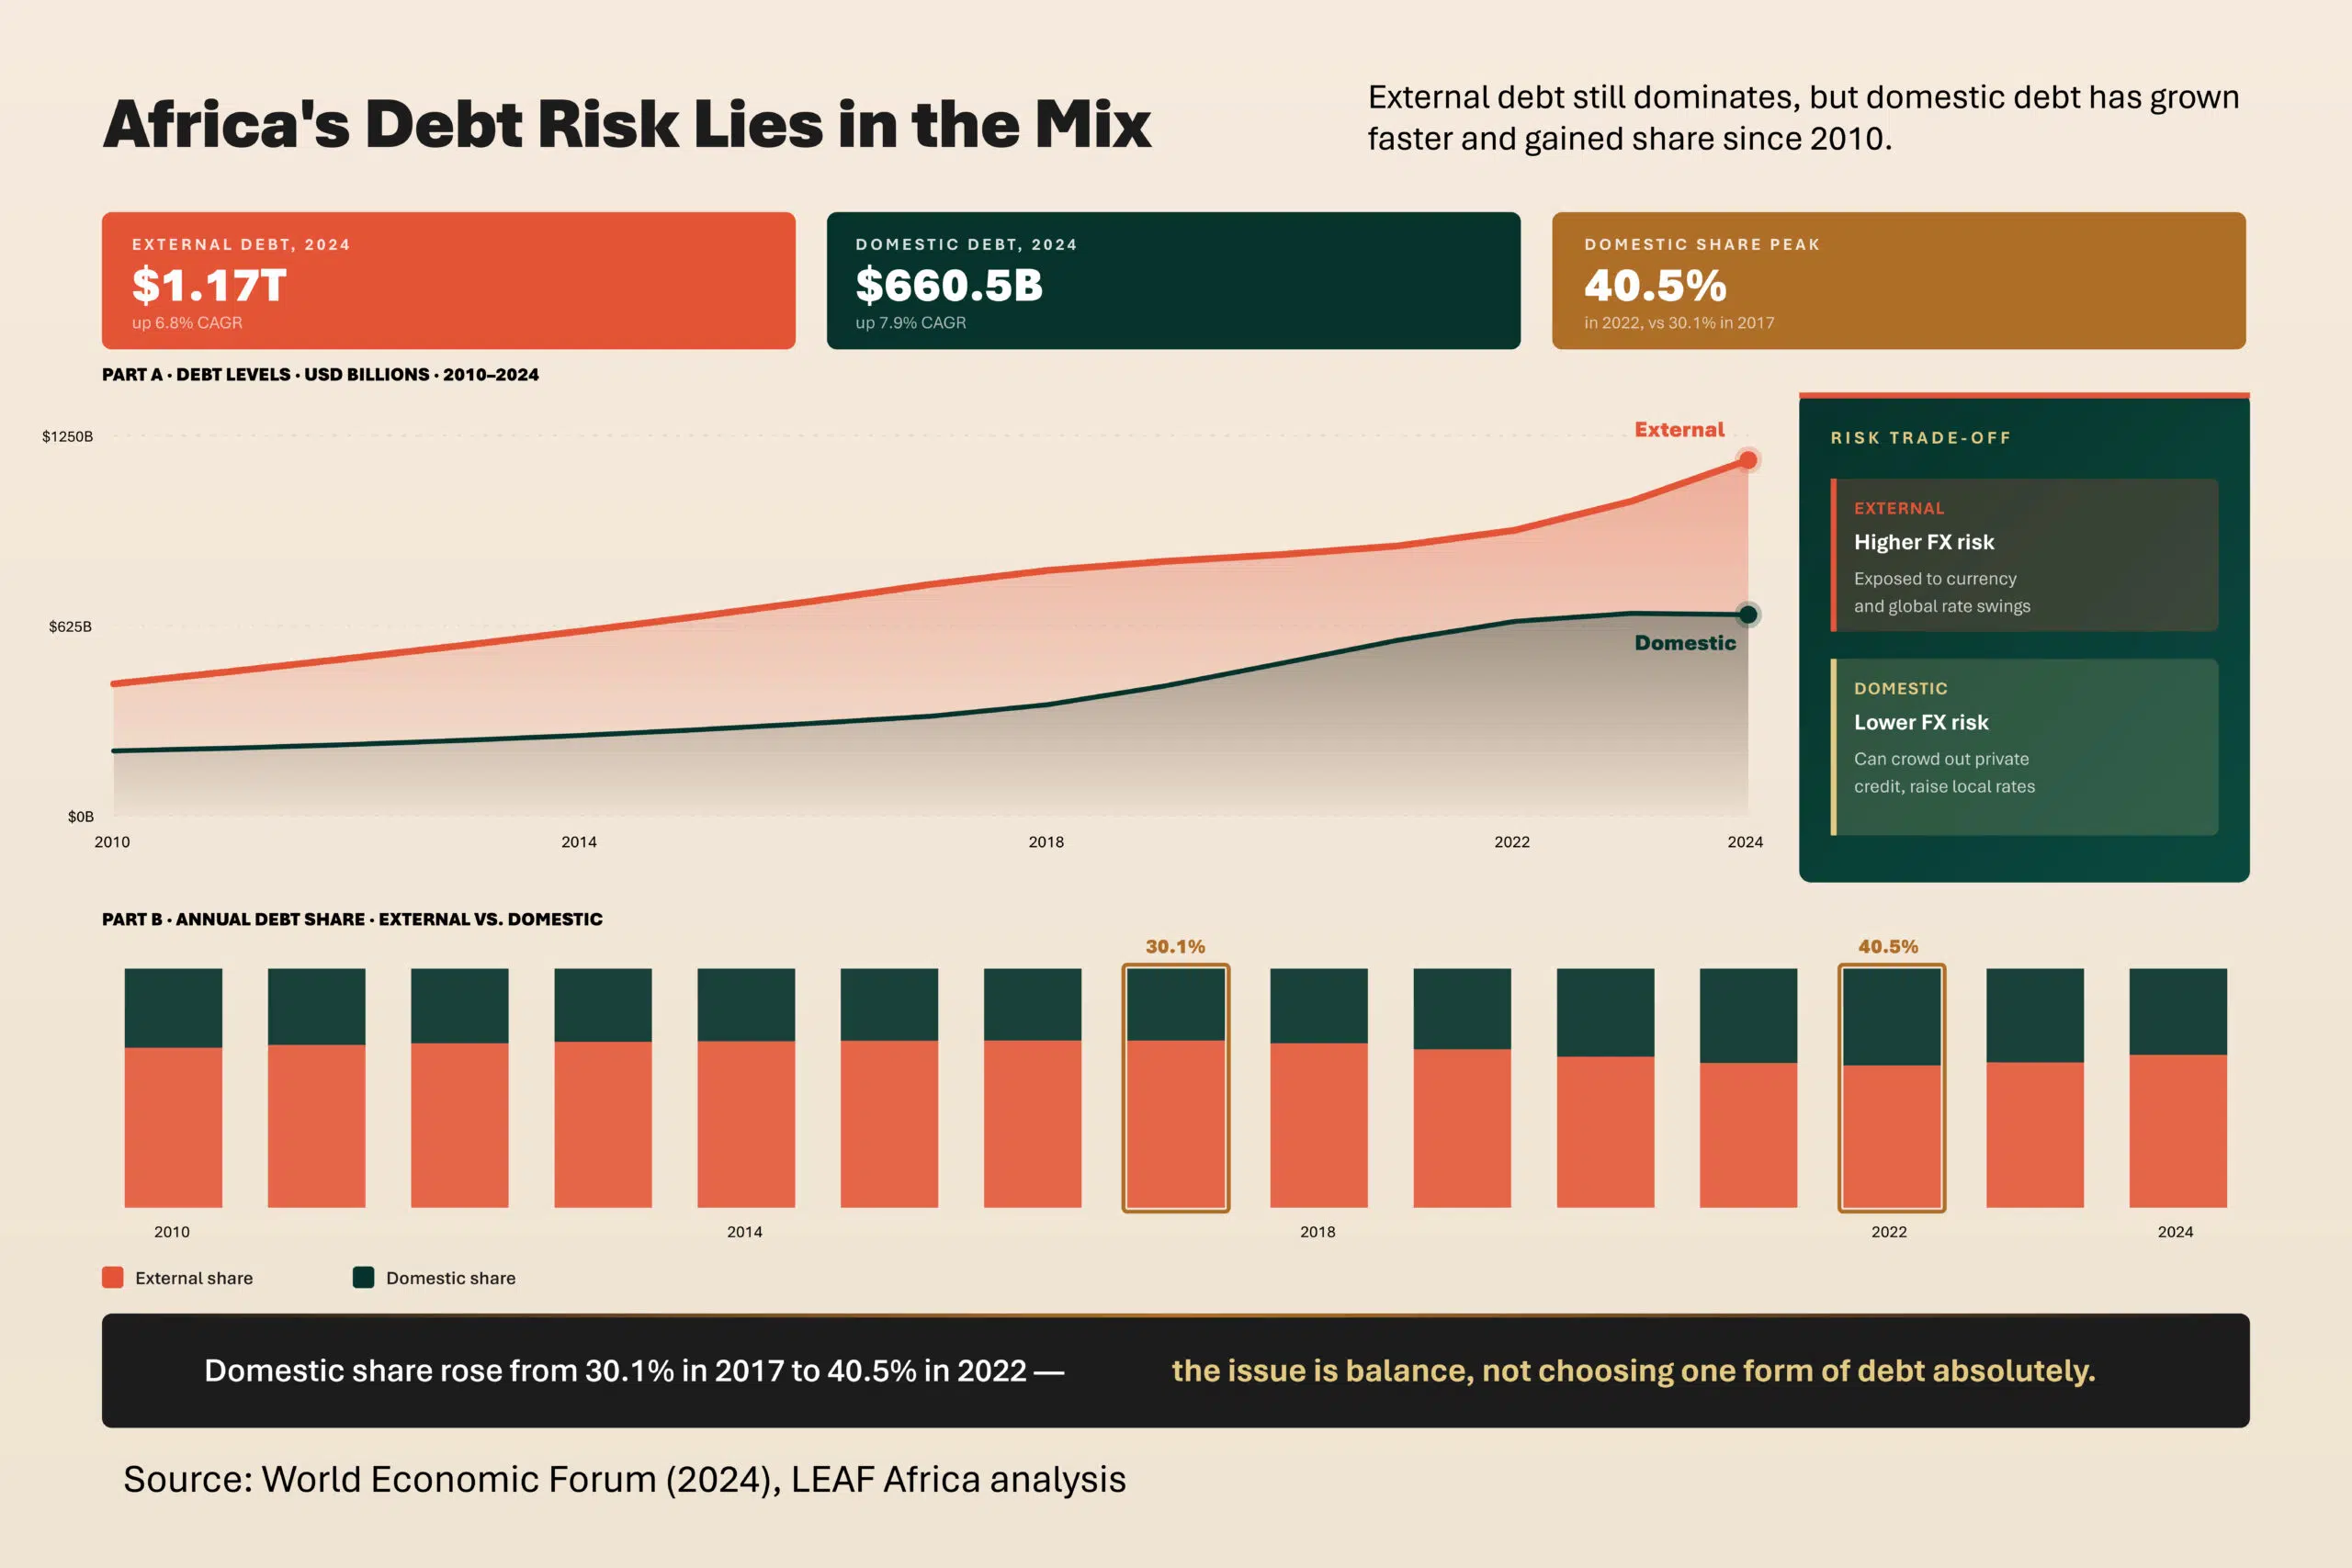
Between 2010 and 2024, both external and domestic debt increased. External debt rose from $435.88 billion in 2010 to around $1.17 trillion in 2024, growing at a 6.80% CAGR. Domestic debt rose from $211.23 billion to around $660.53 billion, growing faster at 7.90% CAGR.
External borrowing still dominates, accounting for about 59% to 69% of Africa’s total debt stock. But domestic debt has become more important. Its share rose from 30% in 2017 to over 41% by 2022, signaling a pivot toward local capital markets as global financial conditions tightened.
Why external debt is riskier
External debt is often denominated in foreign currencies such as the US dollar or the euro. When African currencies depreciate, repayment costs rise in local currency terms.
This creates a fiscal squeeze. Governments may owe the same amount in dollars but need much more local currency to service that debt.
The report notes that external debt makes up most of Africa’s debt, around 60% to 70%, and is riskier because of foreign-currency exposure.
Why domestic debt is not risk-free
Domestic debt reduces foreign-exchange risk because it is usually issued in local currency. It is also easier to restructure in some cases.
But it has a different cost.
When governments borrow heavily from local markets, banks and institutional investors may prefer lending to the state instead of businesses. This can crowd out private sector credit, especially for SMEs and entrepreneurs.
The ideal path is not simply “external equals bad, and domestic equals good.” The better strategy is balance.
African nations need enough local-currency borrowing to reduce FX exposure, while using concessional external financing for large development projects where domestic markets are too shallow.
Africa in Global Perspective: Debt Size Is Not the Whole Story
Debt sustainability depends on both level and structure.
Section 2 of LEAF Africa’s Debt Report compares Africa’s public debt-to-GDP ratio with Europe and advanced economies. Africa’s public debt-to-GDP ratio is shown at 57.1%, lower than Europe’s 80% and advanced economies’ 110%.
At first glance, this suggests Africa is less indebted.
But the comparison is incomplete without considering borrowing cost, currency structure, revenue capacity, and investor confidence. Advanced economies can often carry higher debt because they borrow in reserve currencies, collect more revenue, and refinance at lower rates. African economies often face higher interest rates, weaker currencies, lower tax-to-GDP ratios, and thinner capital markets.
This is why Africa can face greater debt pressure at lower debt-to-GDP levels.
The real question is not just how much debt Africa has. It is how expensive, how risky, and how productive that debt is.
Data Interpretation Layer: What Section 2 of LEAF Africa Debt Report Really Reveals
Section 2 reveals three important truths about Africa’s debt position.
1. Africa’s debt growth reflects development needs and repeated shocks
Infrastructure spending, social investment, commodity cycles, Eurobond access, COVID-19, and global monetary tightening all shaped the debt path.
This matters because policy responses must go beyond austerity. Countries need better debt management, but they also need growth-enhancing investment.
2. Debt risk is concentrated but not identical
Ten countries account for about 72% of Africa’s debt, but sustainability risks differ by country. A large debt stock does not automatically mean distress. A smaller debt stock does not guarantee safety.
Investors and policymakers need country-level analysis.
3. Debt composition is now central to sustainability
External debt exposes countries to FX shocks. Domestic debt reduces currency risk but can crowd out private lending. The policy challenge is to build deeper domestic capital markets without starving the private sector of credit.
This is where Africa’s debt debate must become more sophisticated.
Economic and Investment Implications
Business impact
Rising public debt affects businesses through interest rates, taxes, inflation, currency volatility, and public spending decisions.
When governments face rising debt-service pressure, they may increase taxes, cut capital spending, delay payments to contractors, or borrow more from domestic markets. Each of these outcomes affects firms.
Infrastructure companies may face delayed public projects. Import-dependent businesses may face exchange-rate pressure. SMEs may struggle with higher borrowing costs.
Investment signals
For investors, Section 2 of LEAF Africa’s Debt Story offers a clear framework: do not assess African economies by debt stock alone.
Key signals to track include:
- External debt share
- Domestic debt growth
- Debt-to-GDP ratio
- Currency stability
- Revenue mobilization
- Debt maturity profile
- Refinancing conditions
- Use of borrowed funds
- Reform credibility
Countries that reduce FX exposure, improve revenue collection, and deepen local markets may become more attractive over time.
Policy direction
The policy priority is not debt avoidance. It is a debt discipline.
Africa needs borrowing strategies that align with productive investment, export capacity, local capital market development, and transparent fiscal management.
Debt should fund assets that improve future repayment capacity: power, roads, ports, digital infrastructure, health systems, education, and productive enterprise.
Strategic Implications for Decision-Makers
What this means for investors
Investors should move from regional generalization to country differentiation.
Africa’s $1.83 trillion public debt stock is not one risk pool. Egypt, South Africa, Nigeria, Kenya, Ghana, Angola, and Côte d’Ivoire have different debt structures, currencies, fiscal positions, and reform paths.
For fixed-income investors, this means pricing sovereign risk more carefully. For equity investors, it means assessing how public debt affects interest rates, currency movement, corporate earnings, and government spending.
The opportunity lies in identifying countries where debt pressure is high but reform direction is credible.
What this means for policymakers
Policymakers must focus on the quality and structure of debt.
Key priorities include:
- Strengthening domestic revenue mobilization
- Reducing excessive foreign-currency exposure
- Expanding concessional financing where possible
- Deepening local-currency bond markets
- Improving debt transparency
- Linking borrowing to productive public investment
- Avoiding domestic borrowing that crowds out private firms
Debt sustainability must be treated as a growth strategy, not just a fiscal rule.
What this means for entrepreneurs
Entrepreneurs should understand debt as part of their operating environment.
High public debt can influence lending rates, exchange rates, inflation, taxation, and government spending. It can also affect investor confidence and the availability of local credit.
Businesses in debt-stressed economies need stronger financial planning, diversified funding sources, currency-risk awareness, and pricing resilience.
Conclusion: Africa’s Debt Question Is About Sustainability
Africa’s public debt has grown sharply, from $510 billion in 2008 to $1.83 trillion in 2024. But Section 2 of LEAF Africa’s Africa’s Debt Story report shows that the real issue is not the headline number alone.
The deeper issue is sustainability.
Who owes the debt? What currency is it denominated in? Is borrowing domestic or external? Are governments using debt to finance productive assets? Can countries service obligations without sacrificing growth?
Africa’s debt story is not a simple crisis narrative. It is a structural finance story. Debt can still support transformation, but only if it is affordable, transparent, and tied to economic value creation.
For decision-makers, the message is clear: Africa does need to borrow less. It needs to borrow better.
Go deeper with LEAF Africa
Africa’s debt story is bigger than the headline number. It is about structure, concentration, currency exposure, and the cost of development finance.
Download LEAF Africa’s full Africa’s Debt Story report to explore the charts, country comparisons, risks, and opportunities shaping the continent’s fiscal future.
Subscribe to LEAF Africa for clear, data-driven insights on African economies, markets, policy, and investment opportunities.
The $102 Trillion Debt Question
Global public debt reached a record $102 trillion in 2024, equal to 93% of global GDP. Africa accounts for only about 1.9% of that debt, yet many African…
Continue reading
Share a market signal, question, or useful perspective. You can respond to the article as a whole, or use the "Discuss this section" buttons beside key points to add context.
The discussion space is open. Add a clear observation, a question worth exploring, or a field signal that could help other readers think more sharply.